Useful Links
I am not a meteorologist. Monitor these official sites and your local media outlets for up to date information.
Other Potential Storm Impacts
-
NOAA Storm Surge MapsThese maps can help determine the impact of storm surges from a hurricane depending on the category of the storm.
-
FEMA Flood Map ServiceUse this tool to determine if you are in a flood zone or not.
-
Advanced Hydrologic Prediction ServiceThe National Weather Service provides data on current flooding, flood forecasts, and data on specific bodies of water.
-
NOAA Storm Prediction CenterThe SPC issues convective outlooks that outline the risk potential of severe weather, including hail and high winds. See the right column of this guide for the risk level scale.
-
Waffle House IndexThe Waffle House Index is used as an indicator of storm severity and for gauging the progress of recovery efforts.
-
Know Your ZoneInformation on hurricane evacuation zones, evac routes, flood zone data, and more.
Where to Learn More
-
FEMA EMI CoursesThe FEMA Emergency Management Institute offers a large catalog of free, self-paced classes that include weather related topics. IS-271, 321, and 324 are specifically weather related.
-
NWS SkyWarnThe National Weather Services teaches classes that allow you to become a certified storm-spotter. Advanced classes are also available.
-
CERT TrainingLocal emergency agencies offer Community Emergency Response Team training endorsed by FEMA.
-
American Red Cross ClassesYour local Red Cross office offers classes on a variety of topics, including CPR and First Aid.
-
COMET MetEdFree online training in meteorological topics, sponsored by the NWS.
-
Learning WeatherEducational exercises from the Penn State University Meteorology Certificate Program.
-
JetStreamThe NWS weather education page.
Cone of Uncertainty and the Spaghetti Models
NOAA releases a new hurricane forecast model every three hours. When looking at forecast data, be sure to note the time stamp on the data. The forecast releases are at 8am, 11am, 2pm, 5pm, 8pm, 11pm, 2am, and 5am. Non track-related updates are released every hour with the current latitude and longitude of the storm, speed and direction of movement, and barometric pressure.
This three hour window leads to differences in the spaghetti models. The early models are ones where the model data was ready when the last official forecast was made because they run fairly quickly. Late models indicate data that came in after the forecast was prepared, but still contain useful data because they are run over the course of a few hours. The ensemble models are created by aggregating data from a variety of models and data and creating a combined picture or average of the data from the collected models. This attempts to lessen the spread of various model plots that produce very different tracks, and correct for known model biases from previous storms. A comprehensive list of the models is available here.
Some model outputs have a time stamp followed by a "Z" or "UTC" - this means that the time is in GMT (also known as Zulu time). You can convert between Z/UTC with this chart.
The National Hurricane Center is the best placed to get the most recent version of the forecast cone. In addition to painting a broad picture of where the storm might go, there are other useful pieces of information, including wind speed probability calculations and expected dates and times of impact. They have additional information here.
There are several places to get the latest spaghetti models. Be sure to check the time stamp on the models to ensure that you're getting the latest data. NOAA is currently engaged in research to improve hurricane forecasting to provide better models. Similar research has been conducted in England.
Weather Underground: This is a good place to see the early models, cone, and ensemble models, but note that they don't always update the models every three hours. When viewing the ensemble models, look for the white line - that is the average of the ensemble data.
Hurricane Forecast Model Output: This site updates models several times throughout the day and presents them in a better image format than Weather Underground. It provides early, late, and ensemble models as well as a Google Maps plot of the storm's predicted path.
South Florida Water Management District Weather Data: Presents Florida weather data (not just for South Florida), including a current radar loop, and tropical outlook.
Ventusky Wind, Rain & Temperature Map: A weirdly hypnotic display of real-time temperature and wind models.
Tropical Tidbits: This site aggregates products from several meteorological agencies to provide forecast model data and analysis tools.
MyFoxHurricane Models: A useful site that allows you to show/hide each model one by one on a map. They have additional, advanced models with explanations here.
University of Albany Tropical Cyclone Guidance: In addition to forecast tracks, this site provides statistical information and works out the math on model consensus and reliability. Probably better for advanced readers.
Hurricane Hunter Recon: When aircraft are sent to recon a hurricane, the data they report is posted here.
CIMSS Tropical Cyclones: Storm data including shear and other factors that are often left out of other tracking sites.
Tropical Cyclone Guidance Project: A collection of information for determining the strength and path of tropical systems.
NWS Southern Region Tropical Page: Several tabs of useful information, including predicted storm impacts and foreign weather radar (useful for tracking a storm when it's far out of range of US radar products).
NASA Deep Learning-based Hurricane Intensity Estimator: Tool for scientifically calculating the possible intensity of storms.
Other Forecast Factors
There are several factors that could influence the development and path of a hurricane. This includes ocean temperatures, wind shear, the position of the jet stream, and any incoming or outgoing fronts. Looking at these can help determine the behavior and movement of a storm.
The mountainous terrain of some islands in the Caribbean has a tendency to weaken some systems - a phenomenon meteorologists refer to as the "hurricane graveyard."
The University of Arizona meteorology program has a useful lecture on hurricane formation and NOAA has a hurricane FAQ.
Terminology note: "hurricane" is used for a storm that develop in the north Atlantic ocean and central and eastern north Pacific ocean. They are called "cyclones" in the south Pacific and Indian oceans, and typhoons in the northwest Pacific ocean.
Wikimedia Commons has a brilliant diagram of the anatomy of a hurricane.
Hurricane Science is an extensive guide to hurricanes.
High and low pressure systems can influence the strength and movement of storms. The National Hurricane Center produces a regular graphic of the current front forecasts, available here. As with other data, make sure to look for the time stamp on the data.
This guide will help you interpret these maps. Look for blue lines (cold fronts), and the letter H (high pressure systems) and the lines indicating their movement (or notes denoting that they are stationary). The NWS has additional information on how to interpret fronts, troughs, and other weather map data..
The Jet Stream forecast can help determine the probable path of a storm. A stream that dips far south can push a storm away from the state. You can see various jet stream forecasts and their potential impacts on hurricanes here.
Wind Shear can weaken a storm. You can see a sample wind shear forecast here. Dotted blue lines indicate a decrease in shear, while solid white lines show an increase. The map is also color coded.
NOAA provides data from a large collection of sensor buoys spread throughout the ocean, with storm-specific readings here.. These will provide data on sea temperature, wave height, and barometric pressure. Analysis of sea temperatures are available here.
There are a number of factors that lead to tropical cyclogenesis, including latitude, sea temperature, coriolis force, etc. These factors lead to many tropical systems forming in and traveling along an area of the Atlantic Ocean known as "hurricane alley." Scientists have studied this process and have determined standard storm season activity, allowing them to determine the average areas of origin and storm tracks by month. This data is also available plotted on a grid. You can also find research on which counties are likely to have landfalls.
NOAA measures numerous formation factors, which are available here. NOAA's Climate Prediction Center produces a Tropical Outlook every two weeks.
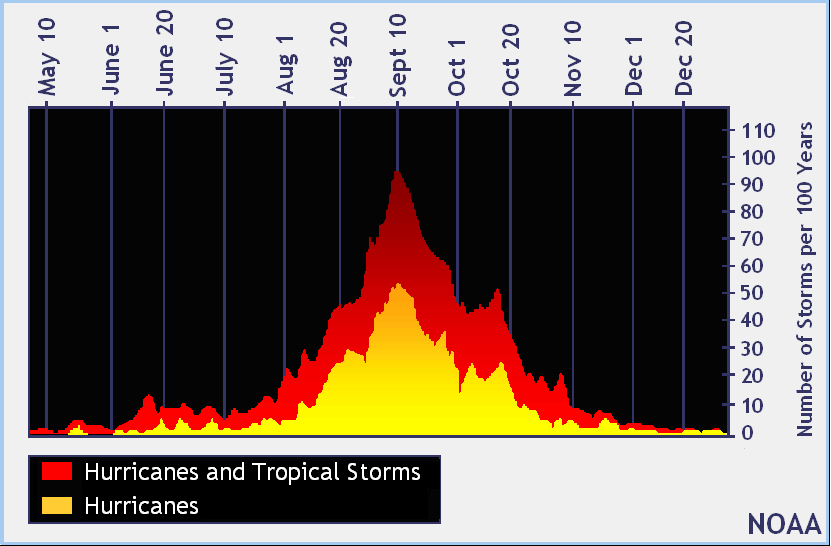
As you can see from the graph below, hurricane season peaks around September 10th.

Dust from the Sahara Desert has an impact on Atlantic hurricane formation because the warm, dry air is not conducive to cyclogenesis. You can see a map of the Saharan Air Layer Forecast here and additional SAL data here.
Measurement & Conversion Guide
Weather information is often given in units that you might not recognize.
Accumulated Cyclone Energy (ACE)
Calculations and Conversions from the National Weather Service
Millibars and Inches of Mercury
Nautical Miles, Statute Miles, and Knots
Saffir-Simpson Wind Scale
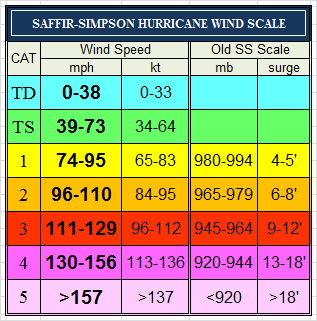
Hurricanes are measured on the Saffir-Simpson Scale. In this hemisphere, hurricanes rotate counter-clockwise. The northeast portion of the storm is sometimes referred to as the "dirty side", since it tends to spawn the most tornadoes.

Fujita Scale
Tornadoes are measured on the Enhanced Fujita Scale.

Convective Outlook Risk Categories
The NOAA Storm Prediction Center issues convective outlooks with the following scale:
Historical Data
-
Atlantic Hurricane Season StatsLists the number of storms per decade going back to 1850. Useful for determining average storms per season.
-
GenDisastersGenealogical research on historical disasters.
-
Historical Hurricane TracksNOAA maintains data on the tracks of all recorded hurricane tracks and landfalls going back to the 1850s.
-
HUDATHistorical hurricane analysis.
-
IBTrACSArchived data about past storms.
-
NASA Hurricane VisualizationDepicts tracks from 1980-2014. Green didn't make landfall in the US, yellow are landfalls that weren't major storms, red are major storm landfalls.
-
Purdue Tornado TracksMapped tracks from 1950-2023.
-
Tornado Environment BrowserInteractive graphs and data visualizations of tornado data over several years.
-
Tropical Cyclone TornadoesAnalysis of tornadoes spawned by tropical systems from 1995-present
About the author of this guide
Paul is the Discovery and Systems Administrator of the Olin Library at Rollins College in Winter Park, Florida. He has served on the Library Disaster Committee for a decade, and is currently the co-chair. He taught EMS for the Red Cross for six years, and has multiple certificates from FEMA, DHS, and the Orlando Citizen's Corps. He is also a NWS Certified Storm Spotter. He is not a meteorologist and this guide is for information purposes only. You can contact him here with comments or suggestions about this guide.

